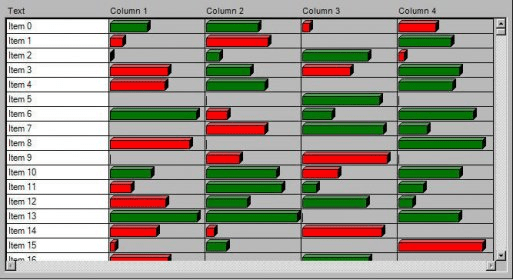
The Community Technologies group at Microsoft Research has developed a set of components for displaying data in .NET applications. Included in this package are: a treemap. A treemap is a rendering of hierarchical data as a set of nested boxes, where each box corresponds to one data element; a bubble chart, which is a set of points displayed as bubbles in an x-y coordinate system; a piano roll is a spreadsheet-like display in which each cell is displayed in a variety of graphical formats; a spire chart (histogram) has a column for each week in a specified year; a thread tree is a hierarchy of nodes; and a time series chart displays multiple time series.
Comments